
GRIT: 'geospatial restructuring of industrial trade'
Our new grant. Intro write-up also up at the Talisman blog. There's a link in there to this interactive viz of the UK's trade flows - a starting point for working on how best to make the spatial economy visible.
---

Alison Heppenstall, Gordon Mitchell, Malcolm Sawyer (LUBS) and I have been awarded an 18 month grant by the ESRC through their secondary data analysis initiative. Titled 'Geospatial Restructuring of Industrial Trade' (GRIT), the motivation for the grant came from a deceptively simple question: what happens to the spatial economy when the costs of moving goods and people change?
That's a good old fashioned location theory question, but 21st century challenges are breathing new life into it. During the next few decades an energy revolution must take place if we're to stand any chance of avoiding the worst effects of climate change. What price must carbon be to keep within a given global temperature? How long will any switch to new infrastructure take? (Kramer and Haigh 2009; Jefferson 2008) In fact, will peak oil get us before climate change does? (Wilkinson 2008; Bridge 2010) In a time when we're discovering costs may go up as well as down, do we have a good handle on the spatial impact this may have? Can we use new data sources and techniques to answer that, in a way relevant to people and organisations being asked to rapidly adapt?
GRIT will focus on two jobs. First, creating a higher-resolution picture of the current spatial structure of the UK economy. Second, thinking about how possible fuel costs changes could affect it. We'll examine the web of connections between businesses in the UK, looking to identify what sectors and locations may be put under particular pressure if costs change. There is a direct connection with climate change policy: the most carbon-intensive industries (also very water intensive) are also those with the lowest value density, and so most vulnerable to spatial cost changes.
Most economics still works in what Isard called a "wonderland of no dimension" (Isard 1956, 26) where distance plays no role except as another basic input, in principle substitutable for any other. Some economic geographers believe that because energy and fuel are such a small part of total production costs, "it is better to assume that moving goods is essentially costless than to assume [it] is an important component of the production process" (Glaeser and Kohlhase 2004, 199). At the other extreme, social movements like the transition network privilege the cost of distance above all else. They make the intuitive assumption that if the cost of moving goods goes up, they can't be moved as far – so localisation is the only possible outcome. They are making a virtue of what they see as economic necessity imposed by climate change and peak oil. At the extreme, some even argue that "to avoid famine and food conflicts‚ we need to plan to re-localise our food economy".
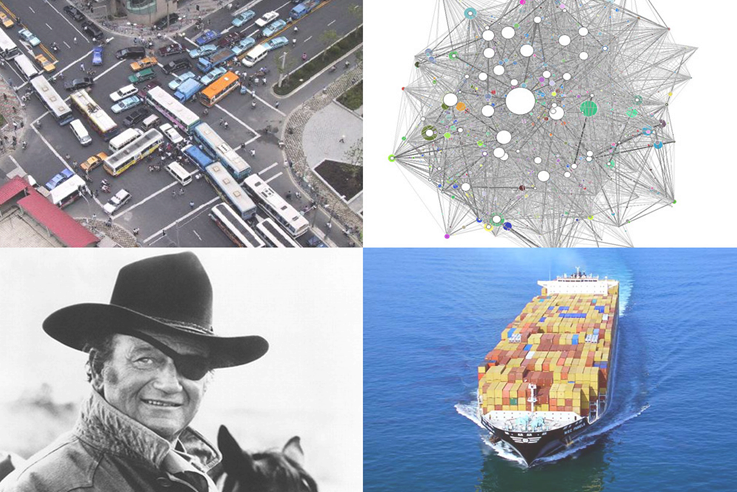
Reality lies somewhere between those two extremes of ignoring spatial costs altogether or assuming a future of radical relocalisation. GRIT is taking a two-pronged approach to finding out: producing a data-driven model and talking to businesses and others interested in the problem. Our two main data sources both use the 'standard industrial classification' code system, breaking the UK into 110 sectors. First, the national Supply and Use tables contain an input-output matrix of money flows between all of those sectors. (I've created a visualisation of this matrix as a network: click sectors to view the top 5% of its trade links and follow them. Warning: more pretty than useful, but gives a sense of the scale of flows between sectors.) It contains no spatial information, however – we plan to get this from our second source, the 'Business Structure Database' (BSD). As well as location information for individual businesses, each is SIC-coded and also provides fields for turnover and staff number. It also has information on firms' structure: "such as a factory, shop, branch, etc". (There's a PDF presentation here outlining how we're linking them, though I'll write more about that in a later post.)
By linking these two (and adding a dollop of spatial economic theory) we have a chance to create a quite fine-grained picture of the UK's spatial economy. From that base, questions of cost change and restructuring can then be asked. The 'dollop of theory' is obviously central to that; we've tested a synthetic version that produces plausible outputs (see that presentation for more info) but 'plausible' doesn't equal 'genuinely useful or accurate'. I'll save those problems for another post also. This sub-regional picture of the UK economy is a central output from the project in its own right and it is hoped it can be used in other ways – for instance, for thinking about how industrial water demand may change over time.
Even before that, two big challenges come with those datasets. First, BSD data is highly sensitive. It is managed by the Secure Data Service (SDS) and can only be accessed under strict conditions (PDF). Work has to take place on their remote server, and anything produced needs to get through their disclosure vetting before they’ll release it, to make sure no firm’s privacy is threatened. These conditions include things like: "SDS data and unauthorised outputs must not be printed or be seen on the user’s computer screen by unauthorised individuals." So, no-one without authorisation is actually allowed to look at the screen being worked on. Crikey. The main challenge from the BSD, however, is getting any of the geographical information we want through their vetting procedure. The process of working this out is going to be interesting. To their credit, the SDS have so far been very patient and helpful. While genuinely keen to help researchers, they also have to keep to draconian conditions – it can't be an easy tension to manage.
The second challenge is really getting under the skin of the input-output data. On the surface, it appears to very neatly describe trade networks within the UK, but its money flows can't all be translated simply to spatial flows. For a start, as the visualisation clearly shows, the largest UK sector, 'financial services', gets the UK's biggest single money flow from 'imputed rent' – which doesn't actually exist as exchanged goods or services. This comes down to the purpose of the Supply and Use table – a way to measure GDP. Imputed rent is a derived quantity used to account for the value to GDP of owned property. That's only one small example, but it illustrates a point: care is needed when trying to repurpose a dataset to something it wasn't intended for – in this case, to help investigate the structure of the UK's spatial economy. It is hoped that less problems exist for more physical sectors, but that can't be assumed.
The second 'prong' is to talk to businesses and other interested parties to find out how they deal with changing costs and to see if the work of the project makes sense from their point of view. We plan to hold two seminars to dig into the affect of changing spatial costs on businesses. Anecdotal evidence suggests suppliers have been citing fuel costs as a reason for price increases for a while now.
A whole range of other groups are keenly interested in spatial economics, though it might not always be labelled thus. An example already mentioned, the 'transition movement' is taking action at the local level. It has, in recent years, developed strong links with academic researchers. A vibrant knowledge exchange has developed between locally acting groups and researchers, with the aim of making sure that "transition and research form a symbiotic relationship" (Brangwyn 2012). It isn't just about spatial economics: it's imbued with a sense that people can play a part in shaping their own economic destiny. It's hoped that GRIT will be of interest here also.
So that's GRIT in a nutshell. There are clear gaps in the project's current remit. Trade doesn't stop at the UK's borders and any change in costs will have international effects (an issue I've been pestering Anne Owen from Leeds School of Environment about). Many of the costs most essential to business decisions are either hard to quantify or to do with people, not goods. (Think about how much it costs a hairdresser to get a person’s head under the scissors from some distance away, e.g. in the rent they pay; this hints at the reason data appears to show the service sector may be the most vulnerable to fuel cost changes.)
Aside from the technical aspects of the project, there are two other things to write about I'll save for later: the nature of distance costs and the place of modelling in research and society. And on that last point, just a bit of brainfood to finish on from Stan Openshaw (1978). In theory, GRIT wants to tread both of these lines, but that's something far easier said than done. (Hat-tip Andy Turner for lending me the book.)
Without any formal guidance many planners who use models have developed a view of modelling which is the most convenient to their purpose. When judged against academic standards, the results are often misleading, sometimes fraudulent, and occasionally criminal. However, many academic models and perspectives of modelling when assessed against planning realities are often irrelevant. Many of these problems result from widespread, fundamental misunderstandings as to how models are used and should be used in planning. (Openshaw 1978 p.14)
--
Refs:
Brangwyn, Ben. 2012. “Researching Transition: Making Sure It Benefits Transitioners.” Transition Network. http://www.transitionnetwork.org/news/2012-03-29/researching-transition-....
Bridge, Gavin. 2010. “Geographies of peak oil: The other carbon problem.” Geoforum 41 (4) (July): 523–530. doi:10.1016/j.geoforum.2010.06.002
.
Glaeser, EL, and JE Kohlhase. 2004. “Cities, Regions and the Decline of Transport Costs.” Papers in Regional Science 83 (1) (January): 197–228. doi:10.1007/s10110-003-0183-x.
Isard, Walter. 1956. Location and Space-economy: General Theory Relating to Industrial Location, Market Areas, Land Use, Trade and Urban Structure. MIT Press.
Jefferson, M. 2008. “Accelerating the Transition to Sustainable Energy Systems.” Energy Policy 36 (11): 4116–4125.
Kramer, Gert Jan, and Martin Haigh. 2009. “No Quick Switch to Low-carbon Energy.” Nature 462 (7273) (December 3): 568–569. doi:10.1038/462568a.
Openshaw, Stan. 1978. Using Models in Planning: A Practical Guide.
Webber, Michael J. 1984. Explanation, Prediction and Planning. Research in Planning and Design. London: Pion.
Wilkinson, P. 2008. “Peak Oil: Threat, Opportunity or Phantom?” Public Health 122 (7) (July): 664–666; discussion 669–670. doi:10.1016/j.puhe.2008.04.007.
Comments
Some random reactions: 1.
Some random reactions:
1. That's some cool, cutting edge research.
2. If it's that complex for a geographic region as small as the UK, imagine trying to (as eventually we must) expanding the scope to global.
3. The pic of John Wayne is genius. :-)
It's that nice part of a
It's that nice part of a project where all our hopes and dreams of what it might be have yet to meet reality! Here's hoping. Also, you're the first person to pick up on the John Wayne reference. It's been in a few presentations and no-one's even asked "why have you got a picture of John Wayne...?"
On "the rest of the world", as I mentioned in the post, I'm talking a lot to Anne Owen in Leeds School of Environment - she's working on global IO models for investigating consumption-based carbon emissions. That stuff is non-spatial, in the sense that any changes in the models have no direct spatial consequence. Even without that, the complexities are, um, complex.
It comes down to what you want the models to do. I don't think they're ever going to create a completely accurate map of reality, but can hopefully help us get a sense of its shape. I always think of the difference to the global economy that containerisation made - I think probably the biggest single impact tech of the 20th century. Couldn't have been predicted. That doesn't invalidate using data and modelling to try and get a better sense of where we're going though. We need to strike some middle ground between pure rejection of quant methods (e.g. critics of economics wanting to shake of the dictatorship of reason) and unwarranted hubris. Tricksy.