
4 stars
How to make completely opposing claims using the same survey data (or: how to cherry-pick)
Thu, 23/11/2017 - 15:53 — dan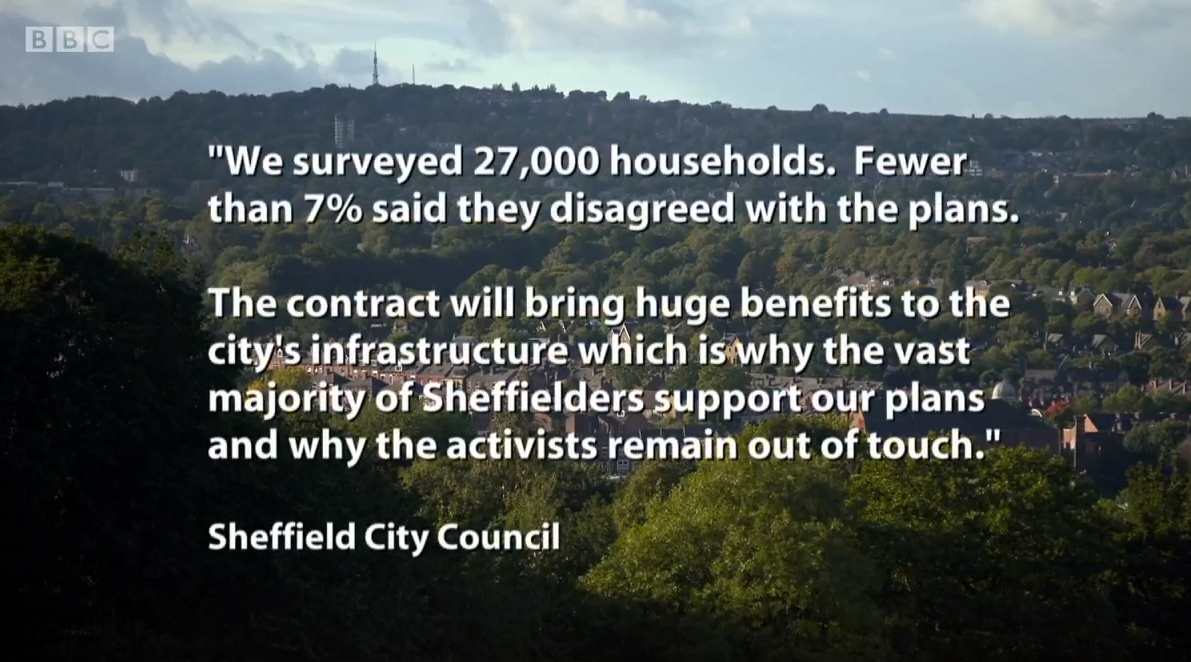
Sheffield Council put out a statement on the BBC recently, during an episode of Countryfile, defending their outsourced Streets Ahead contract against accusations of needlessly felling thousands of mature street trees:
We surveyed 27,000 households. Fewer than 7% said they disagreed with the plans. The contract will bring huge benefits to the city's infrastructure which is why the vast majority of Sheffielders support our plans and why the activists remain out of touch.
Only a small minority ('fewer than 7%') oppose their plans? And 'the vast majority of Sheffielders' are in support? Here's the thing. Using exactly the same data Sheffield Council have used, I could put out the following equally correct statement, in support of the tree protestors:
Fewer than 7% of households said they agreed with Sheffield Council's plans. The vast majority of Sheffielders oppose their plans. The Council remains out of touch.
Wait, what? Only a small minority support the plans? That's entirely the opposite message. How can the same numbers support both of them?
Well, you have to do two misleading things. First, you need to cherry-pick a number. Second, you use a dubious statistical choice that makes it look like a tiny minority oppose the plans, when in reality the data shows an even split of opinion.
Let's go through those two. First, the cherry-pick. The actual survey numbers are as follows. The total number of households they posted letters to is 26677 (round up and you get '27000 households'). 3574 households actually responded - that's 13.4% of total survey invites. Of those 3574, 1774 households opposed the plans and 1800 households supported them.
1774 opposed, 1800 in support? That sounds like something close to an even split of opinion - and indeed, it's not statistically distinguishable from half against, half in support. Not a tiny minority, not a vast majority.
If we cherry-pick just one of those and ignore the other, we're half way to making one of our two opposing statements. The next step: ignore that you should use the number of responses to your survey (3574) to work out the percentages and use the number of letters you posted instead (26677).
By doing that, you can get the 'fewer than 7%' number for both. So we can cherry-pick too: 1800 in support as a proportion of all the letters posted? Fewer than 7%. (1800 over 26677 then multiplied by a hundred to get the percent.)
If exactly the same numbers can be used to produce two completely opposed statements, I hope it's obvious that you're doing something wrong and the numbers are being misused.
The council have defended the statement saying it's factually correct. If you squint, you can just about see how 'we surveyed 27,000 households, fewer than 7% said they disagreed with the plans' is technically true. But I've just shown how the same 'technically true' method can be used to support entirely the opposite message. That's the power of cherry-picking.
And it's not a one-off either. Via the Streets Ahead twitter account, the same data was used to claim only a tiny minority on one street opposed the plans there:
Our household survey results show that of the 54 households on the road, 5% opposed our proposals for street tree replacement.
You won't be surprised to learn: there were only six actual responses on that street, 3 for and 3 against. So again, it's equally correct (but still inappropriate) to say "5% supported our proposals". (It was Rivelin Valley Road, so's you know - again, the numbers are in the document above.)
All of this is ignoring the 'vast majority of Sheffielders in support' statement. In a way, this is the most worrying part. It's just plain wrong, if we're going by this data. But in the context of the 'fewer than 7%' line, I can imagine how one might think, 'well, more than 93% must be in support then'. That's kind of implied, isn't it?
Yet as we've just seen, using the Council's (inappropriate) method, it would actually be 'fewer than 7%' opposed and 'fewer than 7%' in support. They not only omitted to mention this, they have added in a 'vast majority' claim that appears to be completely unfounded. So we're clear, there's nothing in these numbers that even remotely supports a 'vast majority' either for or against. It's an even split.
The ethics of numbers
If your idea of factually correct allows you to make entirely opposed claims with the same numbers, it means you are likely cherry-picking: "pointing to individual cases or data that seem to confirm a particular position, while ignoring a significant portion of related cases or data that may contradict that position". Though here, the cherry-pick wouldn't really work without also mangling how surveys are meant to be used.
I work with numbers in my job: it's a matter of professional ethics to make sure, as much as we can, that our work can be trusted. (Have a read of this code of practice from the UK Statistics Authority - it's a good take on the kind of integrity and honesty we're supposed to aim for.)
We don't know how Sheffield Council created this statement. I can imagine a single over-worked officer under great pressure to get a message out at short notice. But I don't think it's unreasonable to expect the same level of trust from our local councils when they use statistics.
As Ralf Little recently said to Jeremy Hunt (I paraphrase slightly): 'the good news is, now that you know that this statistic is total nonsense, you won’t feel the need to use it again'.
The actual numbers
Let's end on looking at what this survey actually does show - that there's a pretty even split for and against. I should start by saying, we shouldn't really be using the independent tree panel survey1 for this at all. Households were asked their views on trees on their own road. They were not asked, 'do you support or oppose the city-wide Streets Ahead plan for tree management?' They also surveyed households, not individuals. But I guess that's small potatoes compared to the above.
27000 households (rounded up) is the invite number and 3754 is the response number. Trying to maximise response number is central to any survey: the higher the response rate, the more your sample can be relied on to accurately capture what the larger group thinks.
This is hopefully obvious, but let's spell it out to be sure. We don't know what the households who didn't respond think. This is the entire point of surveys: get a sample of views so you can make deductions about everyone else.
So here, the actual split in the response numbers I gave above is 49.6% opposed, 50.4% in support. I may get round to another post explaining why this can't be statistically distinguished from an even 50/50 split - though the intuitive idea is just: how much could that split change as you get more responses? Here, we have a 16% sample - that's pretty big. It's very unlikely to change a lot, but because it's so close to 50%, it could likely shift either side of that 50/50 mark.
At any rate, it is astronomically unlikely that 'fewer than 7%' is the correct percent opposed. For that to be true, all the other households that didn't respond would have to be 100% in favour. The 16% sample would have had to have picked up on every single household opposed. Just... no.
So to end: whether or not the Council knew they were doing this, they have selected numbers to support their own message - as I've shown with a statement claiming exactly the opposite, using exactly the same data and method. This is some way before worrying about sampling rates and confidence intervals. And the 'vast majority' thing... whu?? So let's just end with a tip:
- Check if you can put out two equally true but mutually exclusive statements using your method. If you can, your method is wrong. Try again.
-
Sheffield Council surveyed households, one street at a time, to find out if residents wanted an independent tree panel to re-examine decisions about trees on their street. Again, the data is here. It collated all of those single street surveys into one document. ↩
Recent comments
21 weeks 6 days ago
2 years 12 weeks ago
2 years 12 weeks ago
2 years 14 weeks ago
2 years 15 weeks ago
2 years 15 weeks ago
3 years 12 weeks ago
3 years 36 weeks ago
3 years 36 weeks ago
3 years 38 weeks ago